

A. Business Segments and Introduction
ICICI Bank Ltd. (NSE: ICICIBANK) is the second largest private sector bank in India in terms of assets size and is designated as one of the Domestic Systemically Important Bank (D-SIB) in the country. The total balance sheet size of the bank on a standalone basis stood at Rs. 14,112 bn as on Mar-22. The ICICI Group has a unique franchise with a presence across customer segments, products and geographies, excellent technical capabilities and a diverse talent pool. The bank’s strong market leadership is complemented by its robust franchise of 5,534 branches and 13,379 ATMs across India. The Bank also has wholly-owned subsidiaries in the United Kingdom and Canada with branches across both countries. Besides, it has offices in the US, Singapore, Hong Kong, China, Dubai, etc.
Products and Services of ICICI Bank:
Wealth Management services:
Savings account
Current account
Family wealth account Foreign exchange services Demat account Investments
Fixed Deposits
Recurring Deposits
Lockers
Cash Management Services for Businesses Internet Banking
Cards:
Credit card Debit card FOREX card Prepaid card
Loans:
Personal Loan Business Loan Gold loan Home Loans Car Loans Other Loans
Insurance:
Life insurance Health insurance Vehicle insurance Travel insurance
Payment Services:
Payment Merchant Utility Payments Recharges
Money Transfer
Tax and GST payment
ICICI BANK VALUATION REPORT
Key Business Segments of ICICI Bank
- Retail and Rural Banking
- Rural and Inclusive Banking
- Small & Medium Enterprises and Business Banking
- Wholesale Banking
- Transaction Banking
- International Business
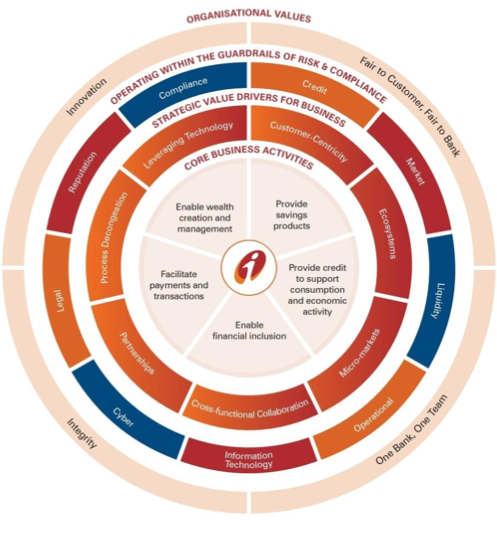
- Government Banking Core Business Activities
- Providing savings products.
- Providing credit facilities to help consumption and better flow of economic activities.
- Enhancing business capabilities by doing proper investments and strategic partnerships.
- Facilitating payments and transactions seamlessly.
- Enabling wealth creation and wealth management.
B. Industry Overview, Value Chain and Profit Too
MARKET OVERVIEW
The Indian banking system consists of 12 public sector banks, 22 private sector banks, 46 foreign banks, 56 regional rural banks, 1485 urban cooperative banks and 96,000 rural cooperative banks in addition to cooperative credit institutions. As of September 2021, the total number of ATMs in India reached 213,145 out of which 47.5% are in rural and semi-urban areas. Total assets across the banking sector (including public and private sector banks) were US$ 2.67 trillion in 2022 and total assets in the public and private banking sectors were US$ 1,594.51 billion and US$ 925.05 billion, respectively.
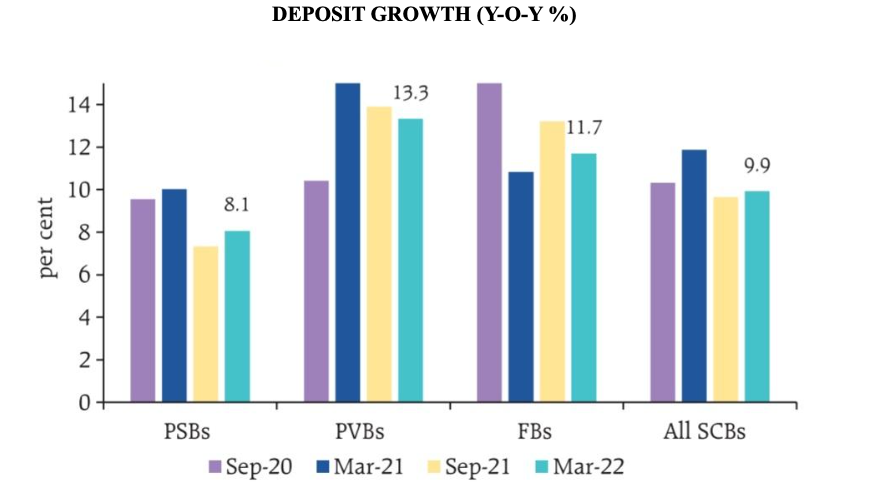
1. Aggregate deposit growth (y-o-y) moderated gradually through 2021-22 reaching 9.9 per cent in March 2022 after reaching a high of 11.9 per cent in March 2021. Growth in current and savings account (CASA) deposits also moderated during this period, primarily on account of public sector banks (PSBs). Nevertheless, CASA deposit growth has exceeded the growth of term deposits for all categories of banks during the COVID-19 pandemic, which partly reflects households’ preference for liquidity in the face of higher uncertainty
2. Bank credit growth picked up during H2:2021-22 and reached 11.5 per cent in March 2022. Non-food credit growth was 8.7% year-on-year on March 25, 2022, compared to 5.5% on March 26, 2021.

As per data on the sector-wise deployment of credit as of March 25, 2022, released by RBI, retail loans grew by 12.4%, credit to the industry by 7.1%, credit to the services sector by 8.9% and to the agriculture sector by 9.9%.
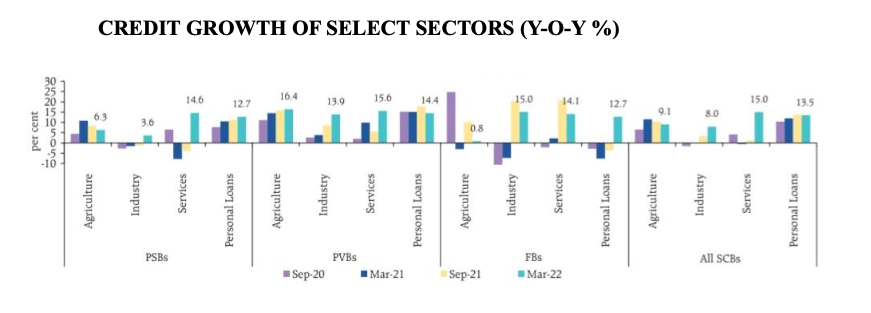
Growth in personal loans remained steady during 2021-22 and accounted for over 30 per cent of incremental lending by PSBs and PVBs. In the personal loan sector, housing loans, credit card receivables and vehicle/ auto loans recorded double-digit growth
3. Asset Quality of Scheduled Commercial Banks continued to improve steadily through the year, with the gross non-performing assets (GNPA) ratio declining from 7.4 per cent in March 2021 to a six-year low of 5.9 per cent in March 2022.

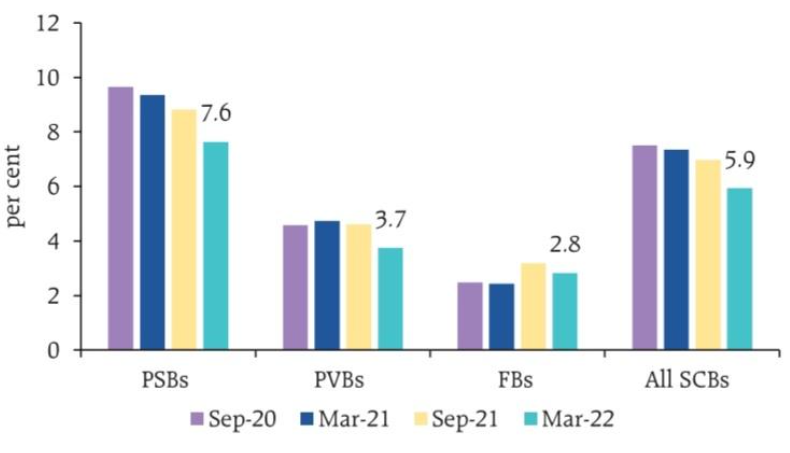
The provisioning coverage ratio (the percentage of funds that a bank sets aside for losses due to bad debts.) improved to 70.9 per cent in March 2022 from 67.6 per cent a year ago. The slippage ratio, measuring new accretions to NPAs as a share of standard advances at the beginning of the period, declined across bank groups during 2021-22. The write-off ratio also declined for the second successive year to 20.0 per cent in 2021-22
The share of large borrowers in SCBs’ loans has also been declining in recent years, indicating a reduction in credit concentration and diversification of borrowers
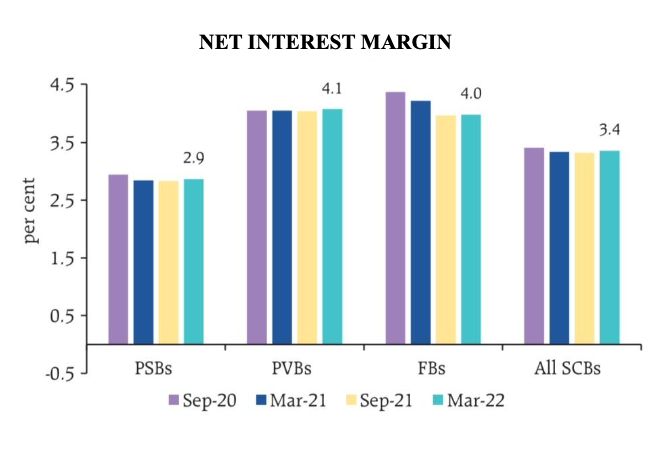
4. Net interest margin (NIM) of SCBs increased marginally during 2021-22 and stood at 3.4 per cent
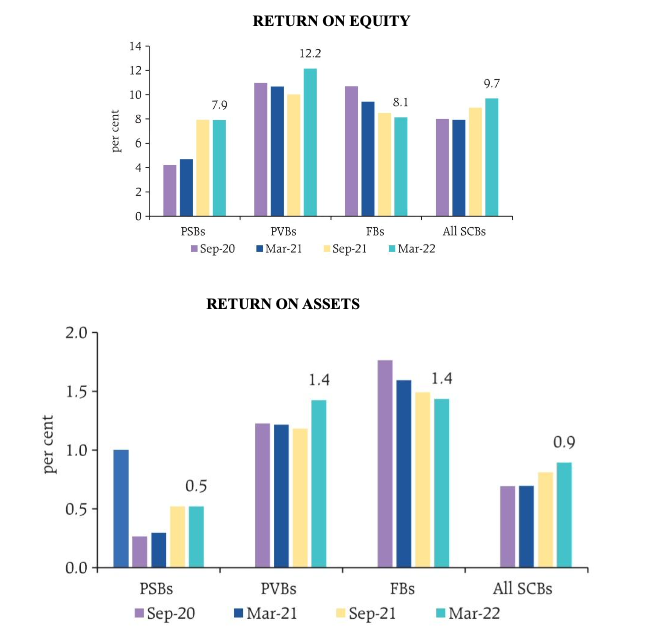
5. The return on assets (RoA) and return on equity (RoE) ratios improved during H2:2021-22.
6. Banks have begun to increase deposit and lending rates during the first three months of fiscal 2023, following the monetary policy tightening during May-June 2022.
KEY MARKET TRENDS
1. DIGITAL BANKING: With a largely young population and increasing adoption of technology by the remaining population, there has been a substantial and visible shift in the demand for financial services. The new generation is demanding enhanced and speedy technology-based services. Thus, banks have started offering automated
banking services through their own digital platforms or indirectly through an outsourced platform. Banks are cutting down spends on branches to invest in self-service digital channels as mobile and online banking become more popular among customers. Many banks are seeking to exploit the opportunities presented by digital, either by leveraging the technologies in-house or by partnering with FinTech companies. Initially, FinTech companies were seen as competitors but now bank-FinTech partnerships are increasingly the norm, with the latter providing marketing, administration, loan servicing or other services enabling banks to offer tech-enabled banking products.
2. DIGITAL PAYMENTS: A 2020 Deloitte report in the aftermath of the lockdown found some significant changes in consumer behaviour with an overwhelming 96 per cent of respondents willing to go for digital transactions for meeting their day-to-day financing needs. Government data shows that digital transactions grew close to 90%, from 232,000 to over 430,000 in the three years from FY19 to FY21, primarily led by UPI. The value of digital payments in India will grow three-fold to touch $1 trillion by the financial year 2026, as compared to $300 billion in the financial year 2021.
3. BNPL: With the rise in fintech companies, the concept of Buy Now Pay Later [BNPL] has revolutionized the banking ecosystem in India. It is now considered to be the new form of consumer lending – where banks are extending the necessary credit in interest-free or spaced-out interest-bearing instalments to its consumers. The BNPL market in India is worth $3-3.5 billion (about Rs 22,500-Rs 26,250 crores) and is expected to grow to $45-50 billion (about Rs 3.37-Rs 3.75 lakh crore) by 2026, according to consultancy firm RedSeer.
4. Bad Banks: To reduce the overall non-performing assets of banks, the budget 2022 had proposed the initiation of the Bad Bank process. The bad bank operates on a dual structure — National Asset Reconstruction Company Limited (NARCL) will be the principal company acquiring the distressed loans and India Debt Resolution Co Ltd (IDRCL) will be its agent that works on resolutions. These Bad Banks have already started the process of resolving more than Rs. 50,000 crore of bad loans. This will ease the burden off banks’ balance sheets so that banks can focus on growth but it may also make banks complacent and encourage further build-up of risky assets.
5. The Union Budget 2022 announced that 1.5 lakh post offices in India would be connected to the core banking system. This step has been taken keeping the rural population and senior citizens in mind, so that more people can enjoy the convenience of digital banking. To support digital banking and FinTech-based ecosystem, the budget proposed that 75 Digital Banking Units (DBUs) be set up in 75 districts by scheduled commercial banks.
6. CBDC- With the rise of blockchain and relates technologies, the Union Budget also announced that the RBI would be introducing India’s own digital currency. The digital rupee or the Central Bank Digital Currency (CBDC) will be launched in the financial year 2022-23. CBDC could lead to a more efficient and cheaper currency management system and become a tool for reducing time and cost for cross-border transactions.
C. Revenue Sources and Competitive Advantages/Disadvantages Competitive Advantages-
a. Shift to retail banking
ICICI Bank is transforming itself from a corporate focused bank to a retail bank. The focus of the management has shifted to lower risk retail loans to increase granularity in the lending book.The Bank’s retail portfolio grew by 19.7% year-on-year to ₹4,546.35 billion on March 31, 2022. Retail loans accounted for 52.9% of total loans. This has led to a reduction in NPAs, growth in the credit card business and better margins. Personal loans have a share of 11 per cent and credit cards contribute 4.5 per cent to the retail book. The bank is also creating new products like Buy Now, Pay Later (BNPL) to get more retail users. This could also lead to better fee income growth.
b. Consumer-centric approach
The bank offers a full array of banking services to customers, including salary accounts, payments, remittances, credit cards, forex, investments, etc. Clearly, the bank is pivoting itself to a customer-centric organisation from a product-centric one. This has been enabled by adopting a solution-oriented approach to meeting all financial needs of a customer and designing solutions that are product and segment- agnostic. The approach is to take the entire bank to the customer and offer solutions for the customers and their ecosystems. The enhanced services improve customer satisfaction and their relationship with the bank.
c. Digital Platforms and Solutions
The Bank’s digital platforms have transformed to provide best-in-class end-to-end seamless digital journeys, with the ability to offer personalised solutions, enable data-driven cross-sell and up-sell, onboard new customers, enable self-service and provide value-added features. The open architecture platforms have enabled the Bank to extend banking services even to non-ICICI Bank account holders. Digital channels account for over 90% of financial and non-financial savings account transactions. These platforms include The ICICI STACK, API Banking portal, iMobile, InstaBIZ, FXonline, Trade emerge, internet banking platforms and many more. All these channels are carefully designed to meet all the requirements of corporate and retail clients and provide customised solutions effectively and efficiently.
d. Digital Payments and Partnerships
The Bank has continued to strengthen its position in the digital payments ecosystem by designing seamless journeys for customers, facilitating higher volumes of transactions and prompting recurrent digital transactions. Its volume of UPI person-to-merchant transactions increased by 57.5% year-on-year in fiscal 2022 and the value of these transactions was 2.3 times the value in fiscal 2021. The Bank also launched several co-branded credit cards to enable customers to earn rewards and benefits. The growth in credit card transactions was driven by a higher activation rate through the digital onboarding of customers. The Bank’s market share in credit card transactions by value increased to 20.1%in fiscal 2022 from14.6%in fiscal 2021. The bank is also a market leader in FASTag with a market share of about 33% in fiscal 2022.
e. Greater focus on SME and Business Banking
ICICI Bank is very well exploiting the opportunities in Small and Medium Enterprises and Business Banking (especially e-commerce businesses). The business banking portfolio grew by 43.2% to ₹534.37 billion and accounted for 6.2% of the overall portfolio on March 31, 2022. The Small and Medium Enterprises segment grew by 33.6% to ₹404.50 billion and accounted for 4.7% of the overall portfolio. The growth in the portfolio was driven by the Bank’s digital offerings and platforms such as InstaBIZ and Merchant STACK and efforts towards process decongestion such as online electronic franking and digital signature-based document execution (Eazysign). It also partnered with Flipkart and Amazon to offer facilities to SMEs to meet their working capital requirements.
Disadvantages/Risks-
a. Rise in High Yield Book
Growing the high-yield book at a pace far ahead of the industry raises the relative risk profile of the book. ICICI Bank’s book comprising personal loans, credit cards and loans against property (LAP) has grown at a heady average of 31.6 per cent (YOY, every quarter). And this could lead to a lower valuation multiple being ascribed to the bank in the days to come. HDFC Bank’s risk-weighted assets to loans ratio is below 100 per cent or 400 bps below ICICI Bank, which indicates higher risk for ICICI bank. The company has sizeable exposure to SME, corporate and unsecured retail credit that might be at risk going forward due to ongoing disruption in the economy. As per the Q4 FY22 earnings the gross NPA additions from the retail, rural and business banking portfolio was Rs 37.36 billion and from the corporate and SME portfolio was Rs 4.68 billion which can be a point of concern.
b. Macroeconomic Uncertainties
The global economy including the Indian economy may not be in the best position for businesses at present. We are facing a situation of high inflation which has forced RBI to implement a contractionary monetary policy to suck out excess liquidity from the economy. There are also underlying fears of an upcoming recession. These factors could be barriers to growth of ICICI Bank.
Strengths
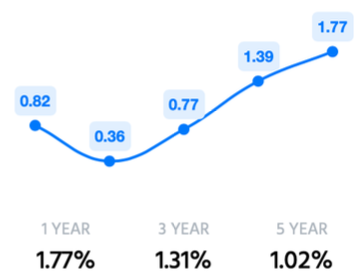
- The bank has been maintaining a healthy ROA of 1.31% since last 3 years.
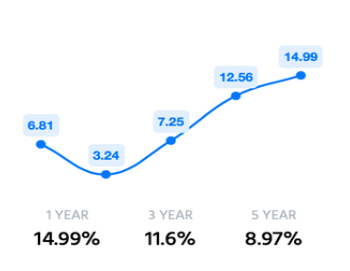
- Company has a good Return on Equity (ROE) track record: 3 Years ROE 11.60%.
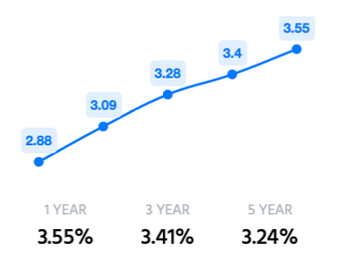
- The company has been consistently maintaining a NIM of 3.41% since last 3 years.
- CASA stands at 48.70% of total deposits.
- Good Capital Adequacy Ratio of 19.16%. ESG profile CRISIL Ratings believes that ICICI Bank’s Environment, Social, and Governance (ESG) profile supports its already strong credit risk profile. The ESG profile for financial sector entities typically factors in governance as a key differentiator between individual banks. The sector has reasonable social impact because of its substantial employee and customer base and can play a key role in promoting financial inclusion. While the sector does not have a direct adverse environmental impact, the lending decisions may have a bearing on the environment. ICICI Bank has an ongoing focus on strengthening various aspects of its ESG profile. ICICI Bank’s key ESG highlights:
- The bank actively finances projects for capacity creation in environment-friendly sectors like renewable energy and other sustainable sectors like waste processing and mass rapid transport. Further, as part of overall credit appraisal process, the bank analyses the environmental impact of a proposed project and assesses its social risks.
- With 11.9 MWp renewable energy capacity, including contracted capacity through power purchase agreements, 30% of the energy requirement at the bank’s three large offices were met through renewable energy in fiscal 2021.
- The bank’s philosophy of meritocracy and equal opportunity in its people decisions led to a large number of leadership positions being held by women over the past two decades. Of the total workforce, around 31.4% comprised of women as on March 31, 2021.
- Majority of the board members are independent directors, none of the independent directors have tenure of more than 10 years and there is a segregation in chairperson and executive positions. The bank has a dedicated investor grievance redressal mechanism and the disclosures put out by it are extensive.
There is growing importance of ESG among investors and lenders. ICICI Bank’s commitment to ESG will play a key role in enhancing stakeholder confidence, given high shareholding by foreign portfolio investors and access to both domestic and foreign capital markets.
D. Financial Overview
Ratio Analysis (IMPORTANT RATIOS FOR BANKING INDUSTRY) :
1. ROE
Return on equity (ROE) is a measure of financial performance calculated by dividing net income by shareholders’ equity. Because shareholders’ equity is equal to a company’s assets minus its debt, ROE is considered the return on net assets.
ROE is considered a gauge of a corporation’s profitability and how efficient it is in generating profits. The higher the ROE, the more efficient a company’s management is at generating income and growth from its equity financing.
ICICI has a very good ROE when compared to its peers. They are quite efficient in generating income from its equity financing.
2. Return On Assets
The term return on assets (ROA) refers to a financial ratio that indicates how profitable a company is in relation to its total assets. Corporate management, analysts, and investors can use ROA to determine how efficiently a company uses its assets to generate a profit.
The metric is commonly expressed as a percentage by using a company’s net income and its average assets. A higher ROA means a company is more efficient and productive at managing its balance sheet to generate profits while a lower ROA indicates there is room for improvement. ICICI bank has been maintaining a healthy ROA of 1.31% (avg. Last 3 years)
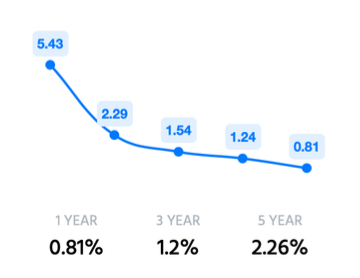
3. Net NPA:
As per the RBI’s circular 2007 “ If a loan provided by a bank is overdue for more than 90 days from the borrower’s end, it comes under NPA. While on the other hand if the loan amount is unpaid for more than 1 year from the due date then it is called a doubtful debt, and if it’s unpaid for more than 3 years then loss of an asset or default account. These circumstances can arise when the borrower intentionally tries not to repay the loan or has gone into huge debt. Under such circumstances, banks try to get the amount back the selling some of the provisions of the borrowers but if they still don’t manage to recover the whole amount then that loan is booked under NPA and written off from the bank’s statement.
ICICI’s Net NPA has been decreasing on y-o-y basis which is a very positive sign and it reflects a very strong loan recovery.
4. NIM:
Net interest margin (NIM) is a measurement comparing the net interest income a financial firm generates from credit products like loans and mortgages, with the outgoing interest it pays holders of savings accounts and certificates of deposit (CDs). Expressed as a percentage, the NIM is a profitability indicator that approximates the likelihood of a bank or investment firm thriving over the long haul. This metric helps prospective investors determine whether or not to invest in a given financial services firm by providing visibility into the profitability of their interest income versus their interest expenses.
ICICI’s NIM is also increasing gradually on y-o-y basis which reflects that its income will continue to increase in future.
Balance Sheet – ANALYSIS
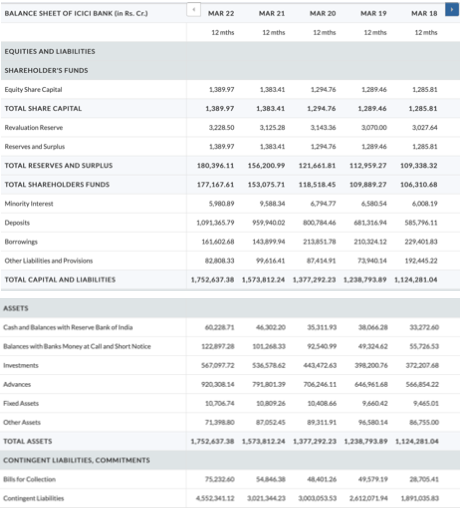
Up to the last quarter, ICICI used to report rural loans as a part of the retail portfolio. From this quarter, they are reporting rural separately. The retail loan portfolio, excluding rural loans, grew by 19.7% year-on- year and 6.0% sequentially at March 31, 2022. Coming to the growth across retail products, the mortgage portfolio grew by 20.3% year-on-year, and auto loans by 11.3%. The commercial vehicles and equipment portfolio declined by 1.3% year-on-year. Growth in the personal loan and credit card portfolio was 31.9% year-on-year. This portfolio was 879.35 billion Rupees or 10.2% of the overall loan book at March 31, 2022. The rural loan portfolio increased by 6.5% year-on-year and 4.3% sequentially. The retail and rural portfolio together grew by 17.6% year-on-year and 5.8% sequentially.
The overseas loan portfolio, in US dollar terms, grew by 5.9% year-on-year and was flat sequentially at March 31, 2022. The year-on-year increase in the overseas loan portfolio was primarily due to increase in the India-linked trade finance book. The overseas loan portfolio was 4.8% of the overall loan book at March 31, 2022. The non-India linked corporate portfolio reduced by 48.2% or about 597 million US Dollars year-on-year and 6.8% or about 47 million US Dollars sequentially. Of the overseas corporate portfolio, about 82% comprises Indian corporates, 10% is overseas corporates with Indian linkage, 4% comprises companies owned by NRIs or PIOs and balance 4% is non-India corporates. ICICI’s direct exposure to Russia and Ukraine is negligible. ICICI has exposure to an Indian oil refinery rated AA- externally where a sanctioned Russian entity owns 49% stake. The exposure is largely non-fund in nature. The oil refinery’s operations are largely in India.
Coming to the funding side: average savings account deposits increased by 22.7% year- on-year in Q4 and 23.5% year-on-year in FY2022. Average current account deposits increased by 23.6% year-on-year in Q4 and 31.0% year-on-year in FY2022. Total term deposits grew by 9.0% year-on-year at March 31, 2022.
Profit & Loss Statement Analysis

Net interest income increased by 20.8% year-on-year to 126.05 billion Rupees. The net interest margin was at 4.00% in this quarter compared to 3.96% in the previous quarter and 3.84% in Q4 of last year. The impact of interest on income tax refund on net interest margin was 1 bps in Q4 of this year compared to 6 bps in the previous quarter and 1 bps in Q4 of last year. The domestic NIM was at 4.12% this quarter compared to 4.06% in previous quarter and 3.94% in Q4 last year. The cost of deposits was 3.48% in this quarter compared to 3.47% in previous quarter. Of the total domestic loans, interest rates on 41% are linked to repo rate and 7% to other external benchmarks.
Non-interest income, excluding treasury income, grew by 11.4% year-on-year to 46.08 billion Rupees in Q4 of 2022.
- Fee income increased by 14.4% year-on-year to 43.66 billion Rupees in this quarter driven by growth across various segments. Fees from retail, rural, business banking and SME customers grew by 14.3% year-on-year and constituted about 77% of the total fees in this quarter
- Dividend income from subsidiaries and associates was 2.32 billion Rupees in this quarter compared to 3.57 billion Rupees in Q4 of last year. The dividend income in Q4 of last year included interim dividend of ICICI General and ICICI Securities PD
On Costs: The Bank’s operating expenses increased by 17.4% year-on-year in this quarter. The employee expenses increased by 21.0% year-on-year. The Bank had about 105,800 employees at March 31, 2022. The employee count has increased by about 7,050 in the last 12 months. Employee expenses in this quarter include an impact of 0.69 billion Rupees due to fair valuation of ESOPs granted to all employees post April 1, 2021 for the current quarter as required by RBI guidelines. Non-employee expenses increased by 15.6% year- on-year in this quarter primarily due to retail business and technology related expenses. The technology expenses were about 8.5% of our operating expenses in FY2022.
The core operating profit increased by 18.7% year-on-year to 101.64 billion Rupees in this quarter. Excluding dividend income from subsidiaries and associates, the core operating profit, grew by 21.0% year-on-year. The core operating profit grew by 22.3% year-on-year to 383.47 billion Rupees in FY2022.
There was a treasury gain of 1.29 billion Rupees in Q4 compared to 0.88 billion Rupees in Q3 and a loss of 0.25 billion Rupees in Q4 of the previous year.
The total provisions during the quarter were 10.69 billion Rupees or 10.5% of core operating profit and 0.53% of average advances. During the quarter we made contingency provisions of 10.25 billion Rupees on a prudent basis. The Bank continues to carry Covid- 19 related provision of 64.25 billion Rupees as contingency provisions at March 31, 2022. Thus, the Bank holds contingency provision of 74.50 billion Rupees as of March 31, 2022. The provisioning coverage on NPAs continued to be robust at 79.2%. In addition, we hold 25.30 billion Rupees of provisions on borrowers under resolution. At March 31, 2022, the total provisions, other than specific provisions on fund-based outstanding to borrowers classified as non-performing, were 179.18 billion Rupees or 2.1% of loans.
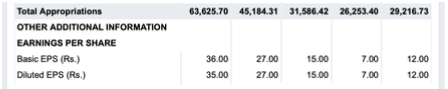
The profit before tax grew by 63.1% year-on-year to 92.24 billion Rupees in this quarter. The tax expense was 22.05 billion Rupees in this quarter compared to 12.54 billion Rupees in the corresponding quarter last year. The profit after tax grew by 59.4% year-on-year to 70.19 billion Rupees in this quarter. The profit after tax grew by 44.1% year-on-year to 233.39 billion Rupees in FY2022.
The consolidated profit after tax grew by 58.0% year-on-year to 77.19 billion Rupees in this quarter. The consolidated profit after tax grew by 36.6% year-on-year to 251.10 billion Rupees in FY2022.
E. Valuation
- Comparable Valuation
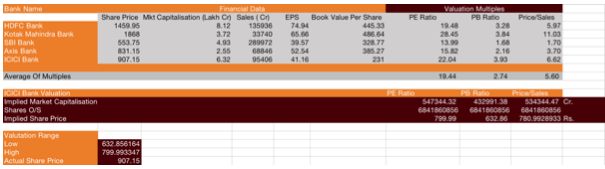
A Comparable Company Analysis (CCA) is a process used to evaluate the value of a company using the metrics of other businesses of similar size in the same industry. Comparable company analysis operates under the assumption that similar companies will have similar valuation multiples.
The Comparable Company Analysis shows the performance of ICICI along with its competitors. The 3 Key ratios taken into consideration for this analysis are Price/ Sales, P/B Ratio, and P/E Ratio. The Mean of these ratios has been compared with ICICI and the analysis shows that the stock is overvalued by approximately 13%.
2. DCF Valuation:
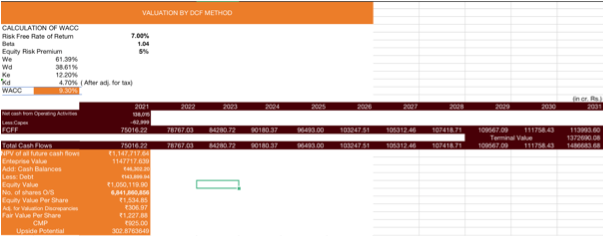
The Discounted Cash Flow (DCF) valuation model determines the company’s present value by adjusting future cash flows to the time value of money. This DCF analysis assesses the present fair value of assets or projects/companies by addressing factors like inflation, risk, and cost of capital, analyzing the company’s future performance. DCF valuation model uses the forecasted free cash flows of a company and discounts them back to arrive at the present value estimate, which forms the basis for the potential investment now.
According to Discounted Cash Flow (DCF) Analysis of ICICI Bank, the company has a Weighted Average Cost of Capital (WACC) of 9.3% which denotes that given the company’s capital weightage of equity and debt the company has to pay a charge of 9.3% for utilising the investor’s money. In the case of ICICI 61.39%% of its capital comprises equity whereas 39.61% is made up of debt. The figures are given in crores. The company has a total equity value of 10 lakh crores with an intrinsic value of Rs. 1227 per share which is a 32.64%upside potential from its October 25,2022 closing Price.
F. Thesis/ Anti-Thesis Pointers in Valuation
Thesis Pointers in Valuation
1. Healthy capitalisation
Net- worth was sizeable at Rs 177,878 crore, while Tier I capital adequacy ratio (CAR) was 17.25% and overall CAR 18.04% (under Basel III), as on June 30, 2022. This makes it one of the well-capitalised banks in India. In fiscal 2021, the bank raised equity capital of Rs 15,000 crore under QIP (qualified institutional placement) to further strengthen its capital position. Consequently, net- worth coverage for net NPAs (non-performing assets) improved to 26.7 times as on June 30, 2022, from 16.4 times as on June 30, 2021 (24.5 times as on March 31, 2022). Moreover, the bank has adequate flexibility to raise resources through sale of stake in subsidiaries (more than Rs 16,000 crore raised in the past few fiscals). Backed by healthy cash accrual and demonstrated ability to raise capital, the bank is likely to maintain healthy capitalisation to support overall credit risk profile and adequately cover for asset-side risks while pursuing credit growth over the medium term.
2. Strong market position
ICICI Bank is among the largest private sector banks in India with consolidated asset base of Rs 17.4 lakh crore as on June 30, 2022 (standalone asset base of Rs 14.2 lakh crore). With advances and deposits of Rs 9.0 lakh crore and Rs 10.5 lakh crore, respectively, as on June 30, 2022, on standalone basis, it is also one of the three banks that has been classified as domestic systemically important banks (D-SIBs) by the RBI, highlighting its significance to the overall financial system. Experienced leadership and management has been instrumental in establishing strong market position for the bank and its subsidiaries. Size, scale and positioning are key strengths of the ICICI group in its various business segments. As a leading full-service universal banking group with pan-India footprint, the group has strong presence in life and general insurance, asset management, private equity and retail broking. Wide geographical spread is reflected in its network of 5,534 branches as on June 30, 2022. The bank is expected to continue its strategy of building upon its established market position in the domestic lending space, particularly in retail lending, while maintaining strong liability franchise. CRISIL Ratings will continue to monitor the developments in balance sheet growth, asset quality performance and management strength and suitably factor them in its ratings on an ongoing basis.
3. Comfortable resource profile
The resource profile is supported by high proportion of low-cost current account and savings account (CASA) deposits. These, as a proportion of total deposits, remain healthy at 46.9% as on June 30, 2022, while average CASA ratio was 45.8% during the firstquarter of fiscal 2023. Furthermore, retail deposits form a significant part of the total deposits and provide stability to the resource profile. Wide branch network and strong focus on digital banking will help maintain higher-than-industry-average CASA levels and competitive funding cost over the medium term
Anti-Thesis Pointers in Valuation
- Significant deterioration in asset quality impacting earnings on sustained basis
- Decline in CARs (including capital conservation buffer [CCB]) with CET I (common equity tier I) remaining below 11% on sustained basis.
G. Stock Performance in Past One Year
During the last 1 year the stock price remained in the range ₹642.15 – ₹943.25. The stock has performed quite well during the last one year and has given a return of 13.40% to the investors.

H. Peer Comparison

ICICI Bank has a market capitalisation of 6.33 lakh crores which ranks it 2nd on the list. According to all the comparable matrices ICICI Bank is in a comfortable position with all of the matrices being close to the industry average . It has a healthy P/E , P/B , ROE(%), ROA(%) ,and CAR multiples which truly justifies its position in the banking industry.

Raghav Mittal
Senior Member
Vansh Sharma
Senior MemberReferences
- https://rbidocs.rbi.org.in/rdocs/PublicationReport/Pdfs/6CHAPTER2FINANCIALINS TITUTIONSEC95E7EF74F34C539B302251A74564EC.PDF
- https://www.icicibank.com/aboutus/Annual-Reports/2021-22/AR/index.html
- https://economictimes.indiatimes.com/icici-bank-ltd/stocks/companyid-9194.cms
- https://ticker.finology.in/company/ICICIBANK

Deepseek: A journey from Hedge Funds to AI
Introduction: In this busy and bustling day to day life of ours managing our Finances…

Beyond Numbers: The Human Cost of Infosys’ Layoffs and the Global Normalization of Workforce Reduction
A Familiar Script: Infosys and the Corporate Playbook of Disposable Labor: On February 7, 2025,…

Understanding Tariffs and Their Impact on India
What Are Tariffs? Tariffs are taxes governments levy on foreign imports to make the goods more…
The Economics of Player Transfers in Football
Introduction: In the world of football player transfers are more than just transactions, they are…

Session 5
Session 5- Unraveling Equity Derivatives: Insights from the Fifth Development Session The Fifth Development Session…

An Attempt To Deteriorate The Creditworthiness of Indian Entities
Introduction: The growth story of India in almost every sector is not alien to the…