

A transfer in football sees a player who is under contract with one club move to another. If a club is open to selling a transfer fee will be negotiated which is the financial compensation for the selling club. Should a fee be agreed between the two teams, then the player in question is granted permission to discuss personal terms with the buying club.
Over the years, we’ve witnessed a huge rise in the cost of football players. Ridiculous amounts of money are being spent on unproven players.
In this article, taking data from the last 10 years, we are going to take a closer look at the rising prices of the football transfer market.
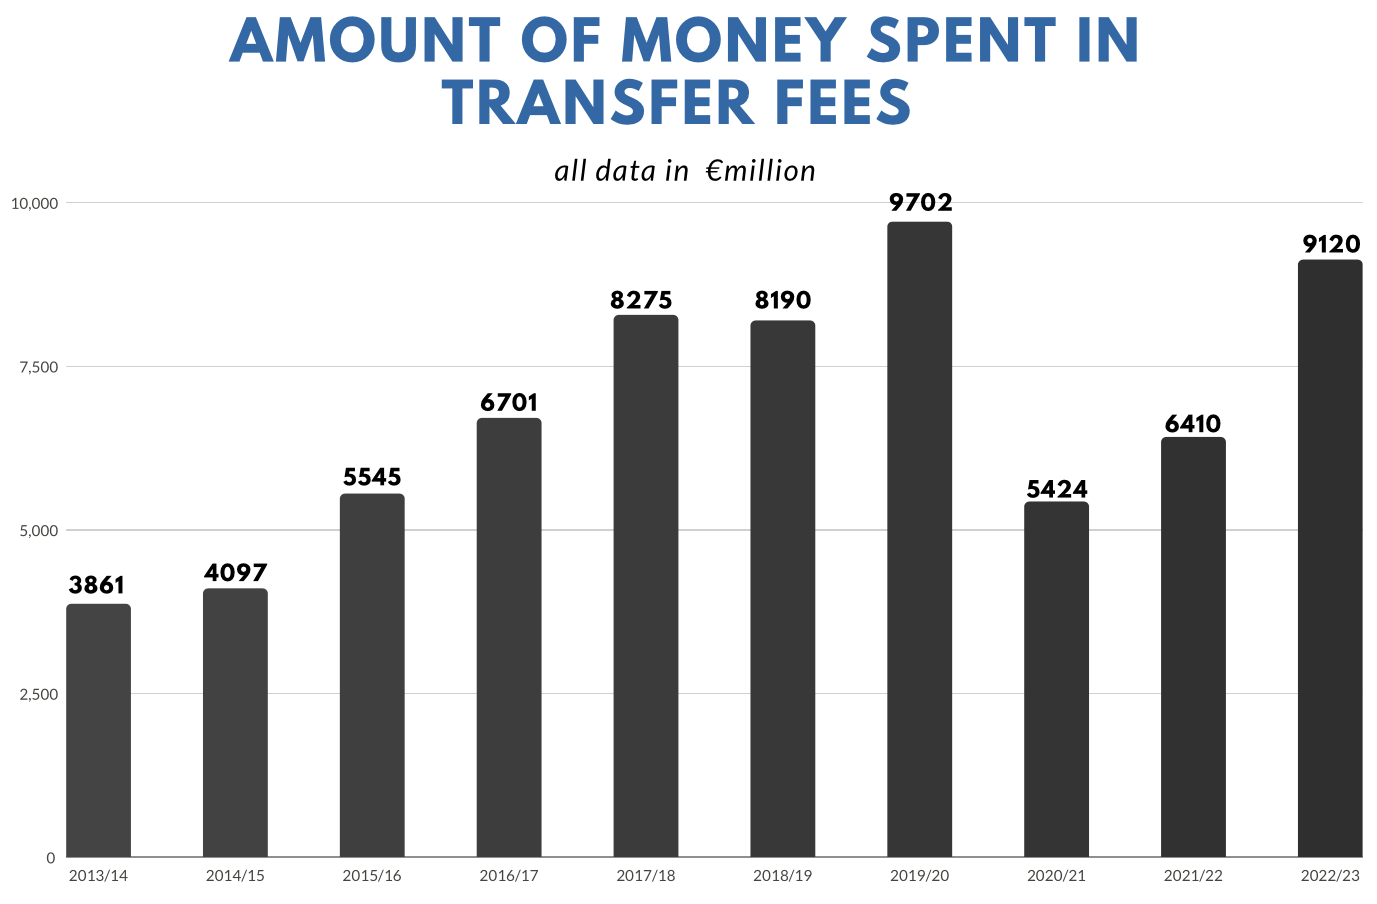
How Much Money has been spent in the last 10 years?
The amount of money spent by clubs to recruit a player has steadily increased from the 2013/14 season to 2019/20 season before a dramatic drop in the 2020/21 season due to the pandemic. The following seasons have seen clubs go back to investing massively on players and the current season(2022/23) data recorded shows it has the second highest amount of money invested in the last decade( 9,120 €M). The highest amount of money spent in a season was 9,702 €M in the 2019/20 season.
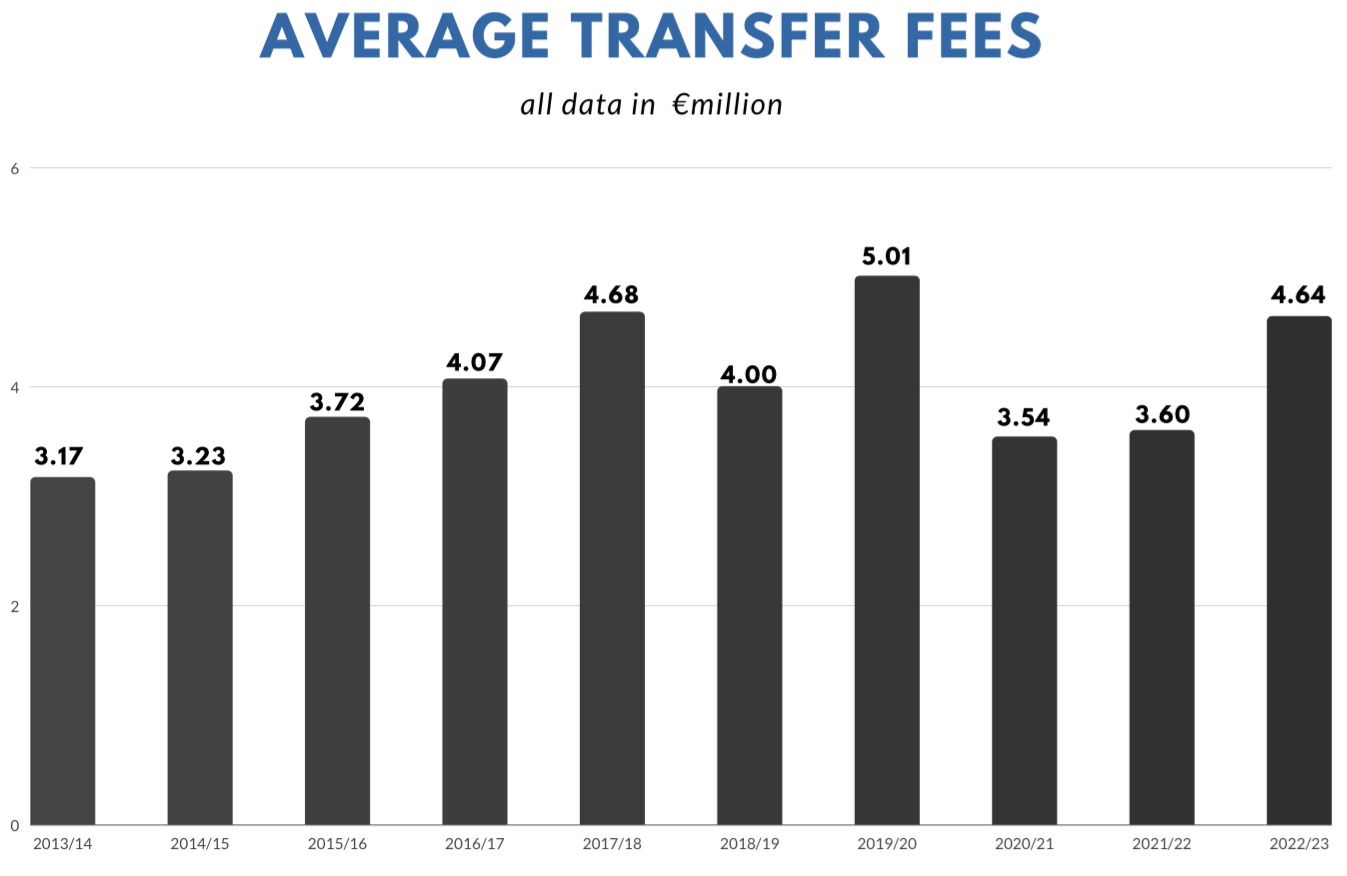
The average fee for a transfer in 2013/14 was 3.17€M and increased till the 2019/20 season. It reached a peak of 5.01€M in 2019/20 before falling due to the pandemic in 2020/21 and then again increasing in the following seasons.
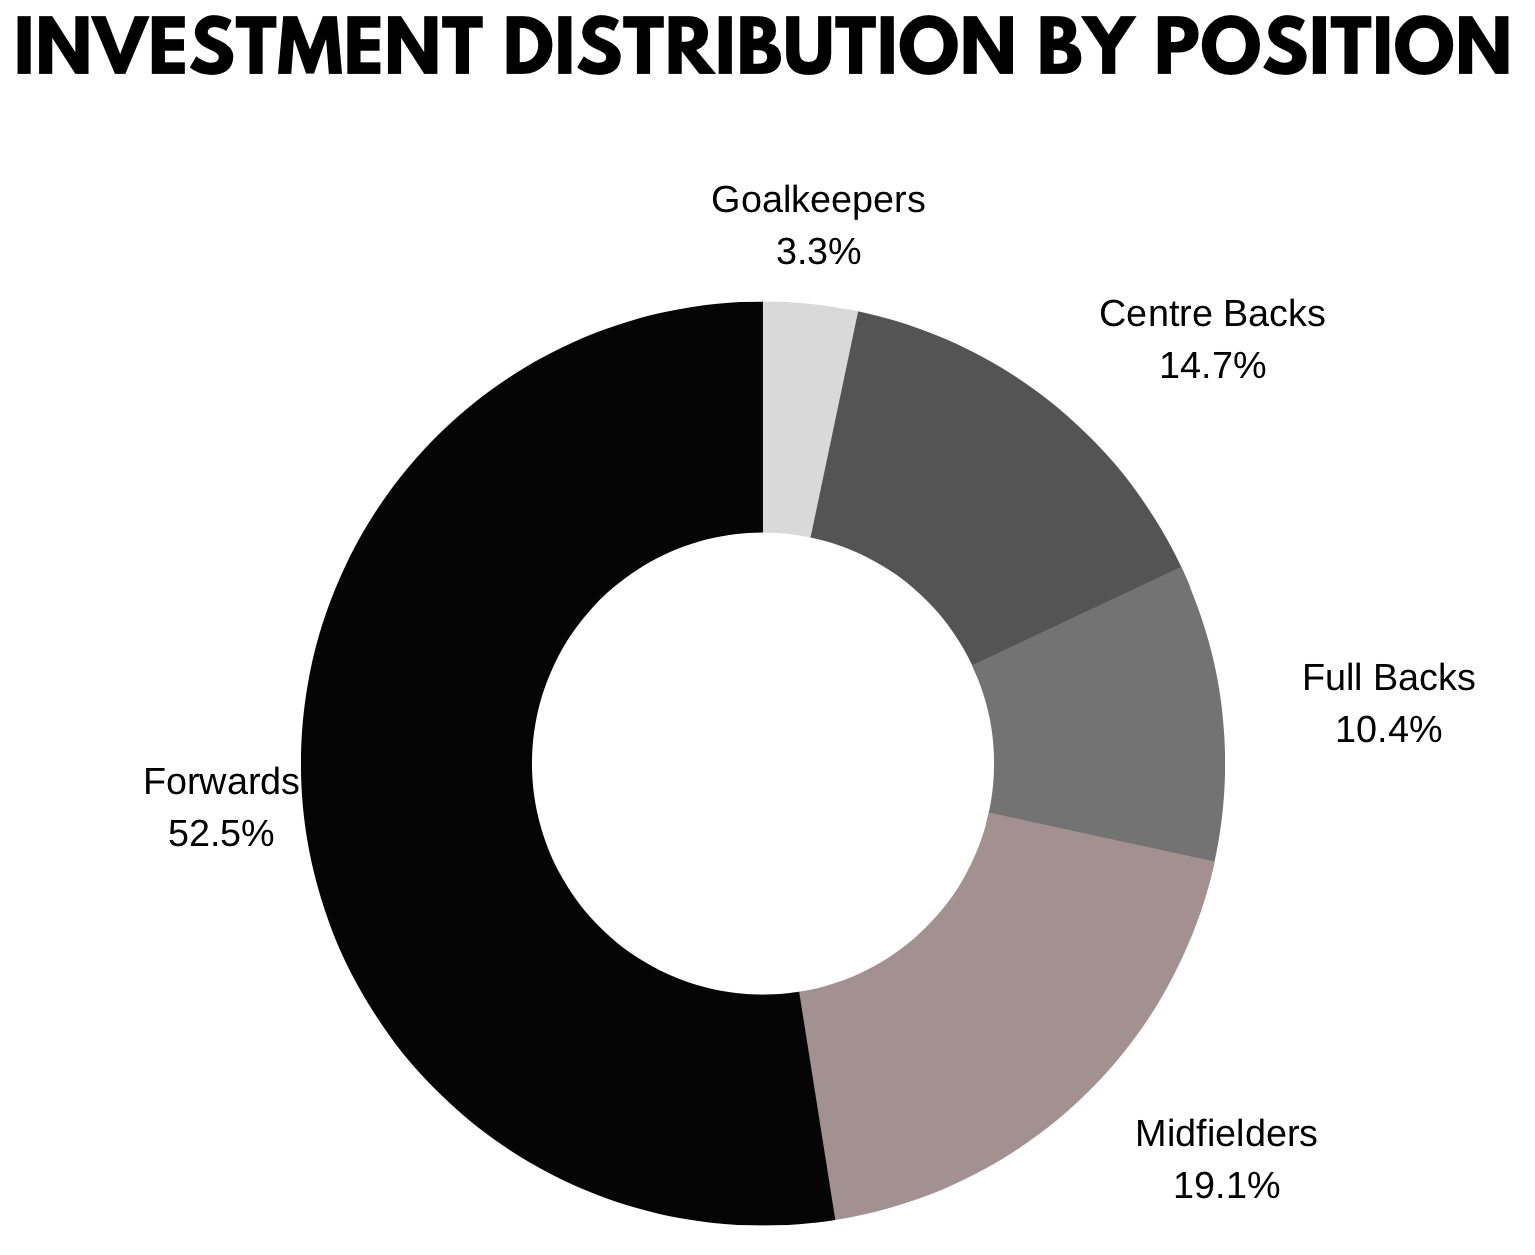
Where is the money being invested and who is spending the most?
There are two main criterias a club looks at before investing in a player. That is the player’s position and their age.
The distribution of investment clearly shows that forwards are the most sought-after position with 52.5% of money spent between 2013/14 to 2022/23. They remain the most in demand on the transfer market, accounting for almost half of the sums committed by clubs over the last decade.
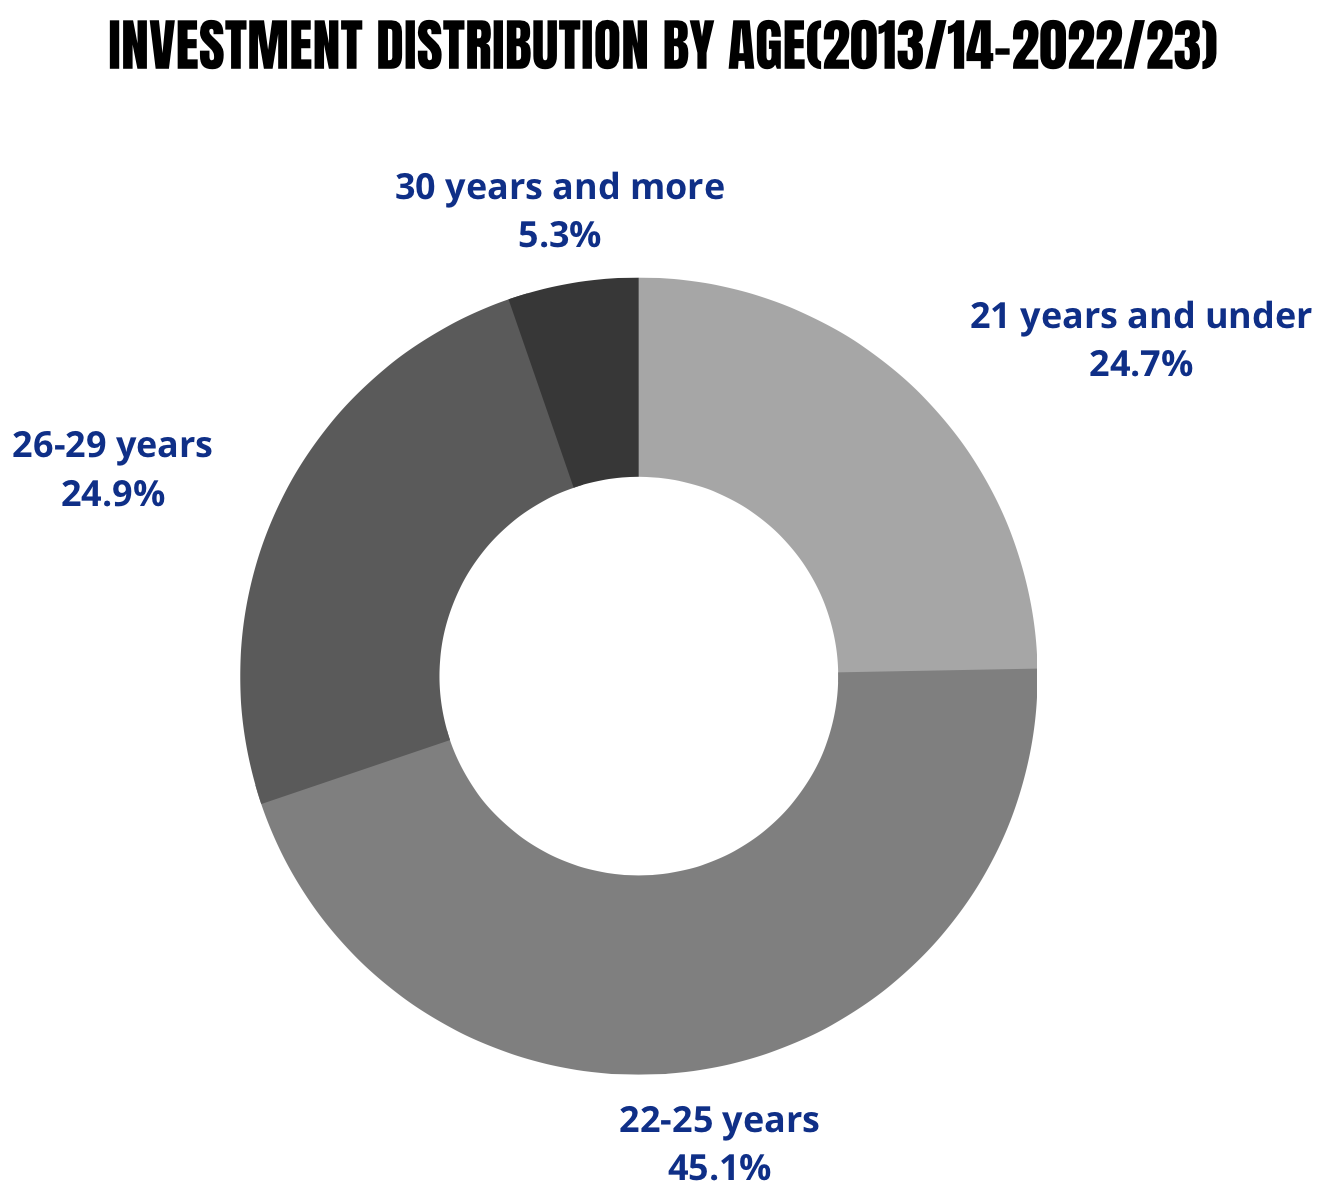
There was a clear increase in sums paid for players between 22 and 25 years with 45.1% of the money being invested in them. In terms of age groups, we’ve noticed that there has been a rise in the amounts paid for players who are 21 years old or younger when they are transferred. The same goes for footballers between the ages of 22 and 25. On the other hand, investments for players aged between 26 and 29 have seen a decrease. This shift is a result of more clubs adopting a player trading strategy to make profits in the transfer market.
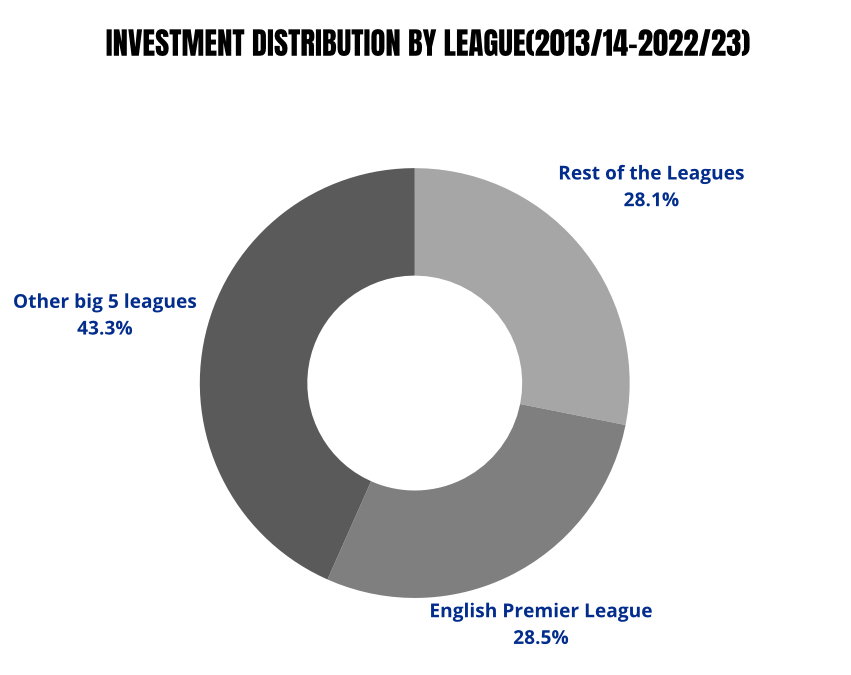
The English Premier League had the highest amount of investment among all the leagues. The English Premier League made up 28.5% whereas the rest of the big 5 leagues contributed 43%. Data clearly shows that the English Premier League is the highest paying league in the world.
The inflation of prices
When it comes to player position, prices have mainly gone up for centre backs (12.5% annual inflation) and full backs (11.1%) compared to the 2013/14 season. Goalkeepers saw the smallest increase (5.2%), while midfielders and forwards both experienced a similar inflation rate of slightly above 8%
TRANSFER PRICE INFLATION ACCORDING TO PLAYER POSITIONS(2013/14-2022/23)
| Position | Annual Growth Rate |
| Goalkeepers | +5.2% |
| Centre Backs | +12.5% |
| Full Backs | +11.1% |
| Midfielders | +8.5% |
| Forwards | +8.2% |
There were significant differences in the inflation of transfer prices based on the players’ age. As the age of footballers transferred increased, there was a progressive drop in inflation. On average, the price of players aged 21 or under at the time of transfer increased by 12.8% annually over the past decade. For players transferred between 22 and 25 years of age, this figure was 9.8%, dropping to 7.0% for those aged between 26 and 29, and finally to 3.6% for footballers aged 30 or over.
TRANSFER PRICE INFLATION ACCORDING TO AGE (2013/14-2022-23)
| Age | Annual Growth Rate |
| 21 years and under | +12.8% |
| 22-25 years | +9.8% |
| 26-29 years | +7.0% |
| 30 years and more | +3.6% |
English Premier League clubs had a higher increase in transfer prices compared to teams from the rest of the world. The inflation rate for transfers to English Premier League clubs was 12.6%, while it was 8.5% for clubs in other big-5 leagues and 7.7% for remaining teams worldwide.
TRANSFER PRICE INFLATION ACCORDING TO LEAGUE(2013/14-2022/23)
| League | Annual Growth Rate |
| English Premier League | +12.6% |
| Other Big 5 leagues | +8.5% |
| Rest of the leagues | +7.7% |
Over the last 10 years, there has been a 116% rise of prices in the transfer market. The cost of buying a player increased by 13.8% annually between the 2013/14 and 2019/20 season. Due to the pandemic there was a drop of 0.2% in the next three seasons but player prices resumed their rapid growth in 2022/23. The past decade, player prices have increased at an average rate of 9% approximately.
| Season | Indexed theoretical value | Evolution since 2013/14 |
| 2013/14 | 1.00 | = |
| 2014/15 | 1.17 | +17 |
| 2015/16 | 1.31 | +31 |
| 2016/17 | 1.67 | +67 |
| 2017/18 | 1.99 | +99 |
| 2018/19 | 1.94 | +94 |
| 2019/20 | 2.18 | +118 |
| 2020/21 | 2.61 | +16 |
| 2021/22 | 1.98 | +98 |
| 2022/23 | 2.16 | +116 |
CONCLUSION
During the 2022/23 season, English top division clubs accounted for a record percentage of transfer fees worldwide, with 40.2% compared to an average of 25.4% between 2013/14 and 2019/20. There has also been significant inflation for center backs (+12.5%), full backs (+11.1%), and players aged 21 or under (+12.8%). The transfer fees for professional football players have significantly increased in the past decade. The total amount for the 2022/23 season is around €9 billion, the second highest since the record-breaking 2019/20 season. The rebound seen in the 2021/22 season after a drop in the 2020/21 season has continued, with a new record set for the winter transfer window in January 2023.
Aadi Aneja
Senior Member